A debt-to-assets ratio is a formula that takes all your debt (house, car, etc..) and divides it by all the assets you have (savings, investments, etc..) to give you a number. Ideally the lower the number the better.
At the beginning of my personal finance journey, my goal was to find a way to save money. Figuring out my debt-to-assets ratio wasn’t even on my radar.
Over time, I started to save a healthy portion of my monthly income, saving over 10% a month was a big feat for me.
Then I did it for several months, and eventually I was saving over 15-20% a month from my monthly income. It’s just like working out, start small, and keep pushing your resistance to higher levels to test your limits.
Once I started saving well, I wanted to optimize the money I saved. I share in another post how I did that by setting up a high-return savings account.
Because, the next step after saving more and more money, is to make sure that your money is also working for you by helping create more of it.
Typical banks in the U.S. give out a measly 0.05% interest rate, and thats an annual rate of return. It’s shocking.
The place I store my savings money (for emergency funds, saving for a future car, future house, etc..) gets up to 2% interest per year.
Now that enough money is saved and delegated to grow, I started investing money. Once I saw that I was saving money every month for over a year, I started taking about half of the money that I would save and put it towards investing.
Nowadays I fluctuate on investing almost 60% of the monthly money I save because I see that my savings funds are doing well. I’m working out my investing muscle since my savings muscles are nice and strong.
Just like working out in real life, you should work out your whole body, so no one part looks oddly large and the other oddly small.
Similar to investing and saving, you should always keep it at a nice balance, unless you see great investment opportunities one month, or need to save more to meet a savings goal that’s short term.
Since the first few days of me getting serious about my personal finance, I have always had a spreadsheet on my computer. For the first few years it was an Excel sheet.

In early 2019, I moved to Google Sheets, because I could look at the spreadsheet anywhere. I’d find myself reviewing my finance spreadsheet while I was waiting for my haircut at the barbershop, or just in the car on a long trip.
I realized that the more I looked over the spreadsheet, the more my mind worked on goals that I had, and the more consistently I was moving towards them (with the ups and downs that always come).
4 years ago, I started including a debt-to-assets ratio in my finance spreadsheet, and I was hooked on making that number go down over time.
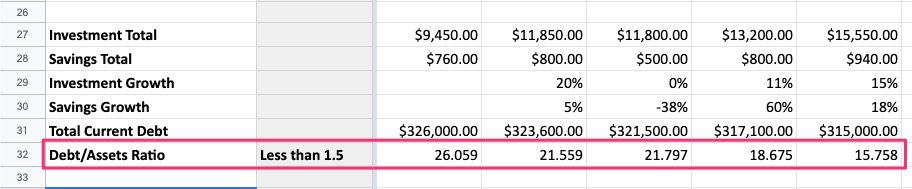
The above spreadsheet (which you can get for free here) is an almost exact copy of my personal spreadsheet, without the real numbers.
This simple formula takes all your different assets and compares that to your debt, and gives you a number.
You can see above that the numbers are pretty high, but I wrote my personal goal to have my number stay below 1.5 (I forgot to remove that note, haha).
From my review of finances over time, I think anything below 2 is good, and the lower you get your debt-to-assets ratio, the better. Push that sucker as low as possible.
Let’s get into some more details about why I love this simple debt-to-assets formula in my spreadsheet, and why you should setup your sheet right away to see what your number is.
It’s not all about saving money, what if you have a pile of debt?

Think about it, if you were proud to have $200k in your savings account, would you still be super proud if you knew you also had $300k in a home mortgage and $60k in 2 car loans?
You have more debt than cash now. While a home mortgage is seen as “good debt”, it’s never good to over leverage yourself with debt in general.
The debt-to-assets number in your spreadsheet helps you see a true balance of the money you own, vs the money you owe.
We live in a world (especially in the U.S.) where having debt is seen as okay. While it’s okay to have debt if you can pay it off, this formula helps me see if upcoming big purchases would throw off my D/A ratio and get me into too much debt.
It helped me see which debt was closest to ending, and I attacked it with anything extra.

So earlier I told you that I started my personal finance journey by first saving money, then getting the best interest rate on my savings account, and then starting to invest money.
As I got older, and my lifestyle changed, I started incurring more debt. I got married, bought a house, cars, and the family grew.
This is all mostly normal stuff. As we got the new house and cars, I added them to my debt area in my spreadsheet, and started tracking the debt every month.
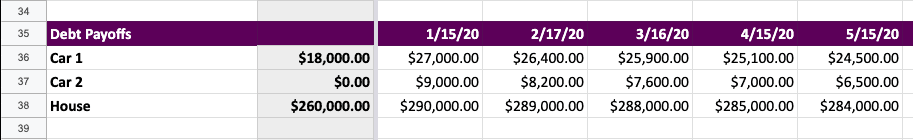
Currently, I have exactly these 3 debt payoffs in my own personal spreadsheet. I don’t include credit card debt, because we pay that off every month.
It’s so gratifying to see the debt get smaller every month. This area also helped me pick out the next debt to attack.
I’ll pay off the normal amount for all debt, but really fight one in particular that’s either the highest interest rate, or in my case, the one that’s about to end soon.
For me, that’s Car 1. The image above shows sample numbers, but in my personal sheet, Car 1 has only $5,000 left to pay off, whereas the other debts are much more than that.
If I ever have extra money after my savings and investing goals, I’m gonna punch that debt in the face by paying more of it off, so it can be gone.
Doing that will definitely help reduce my debt-to-assets ratio too 😁.
It helps me experiment changes like what buying a new car or house would do to the debt-to-assets number.

Going back to that “debt payoff” section in my Google spreadsheet, I would simulate upcoming big debt by adding it to the sheet, and seeing what it would do to the rest of the numbers.
Let’s say we’re planning on buying a 3rd car, I could add the average cost we’re willing to budget, and seeing how that would change my debt-to-assets ratio.
Remember I said that I wanted to stay under at least 2, if the number brought me up to something like 3.5 I know that we might need to save a bit longer to afford that car.
Conclusion
The goal of this post was to shine some light into this beautiful D/A ratio. I watch it every month like a hawk, and I hope you start doing the same.
I set the 15th of every month as my review day, where I open this spreadsheet and update all the numbers. I find that doing it once a month is best.
Download my spreadsheet, make it your own, and pick one day a month where you update the numbers. Over months and years, you’ll see beautiful changes happening and it will help you reflect on the past.
Best thing is you can do this all from one spreadsheet, I have never needed another file to manage my finances.
What questions do you have? Let me know in the comments below, and let’s get started on improving your personal finances!
